Table Event
Table Event: This video contains how can user create an event for table in OPNBI.
tip
Only users with Dashboard privilege have access to this section!
Read 5 minutes tutorial here.
- To Create a apply an Event to a table follow the steps below:
Create a new dashboard and give name Summary of the dashboard.
The Edit menu box appears as you click on Table Widget icon. And a widget gets added in content place automatically in dashboard.
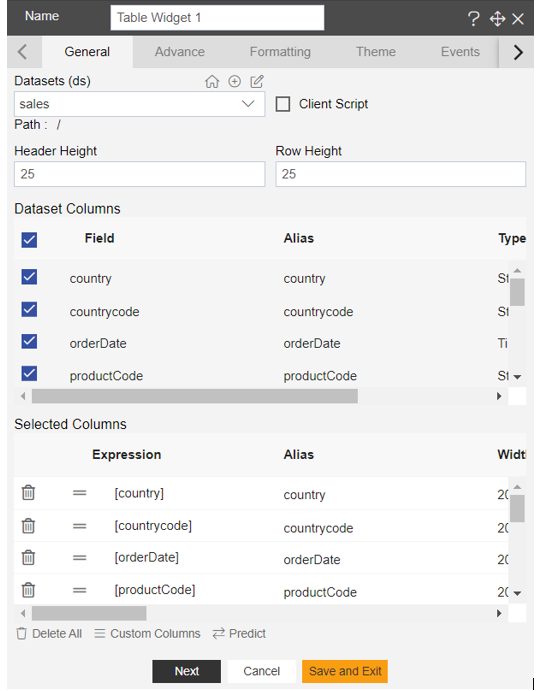
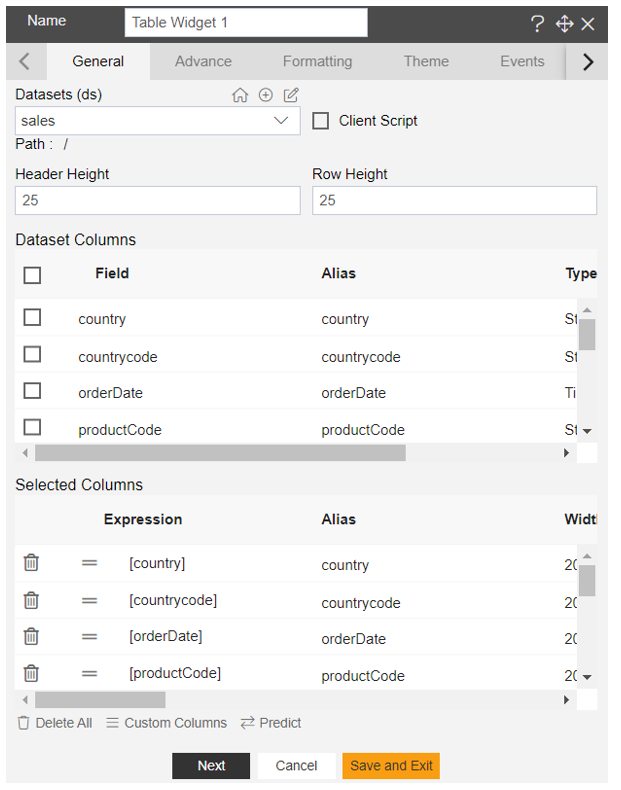
Enter Following details in General Property.
- Dataset: sales.ds
- Select all the field in Dataset Columns.
- Fill above details as shown in figure below:
- Go to advance tab and drag and drop Country and Product line column in row.
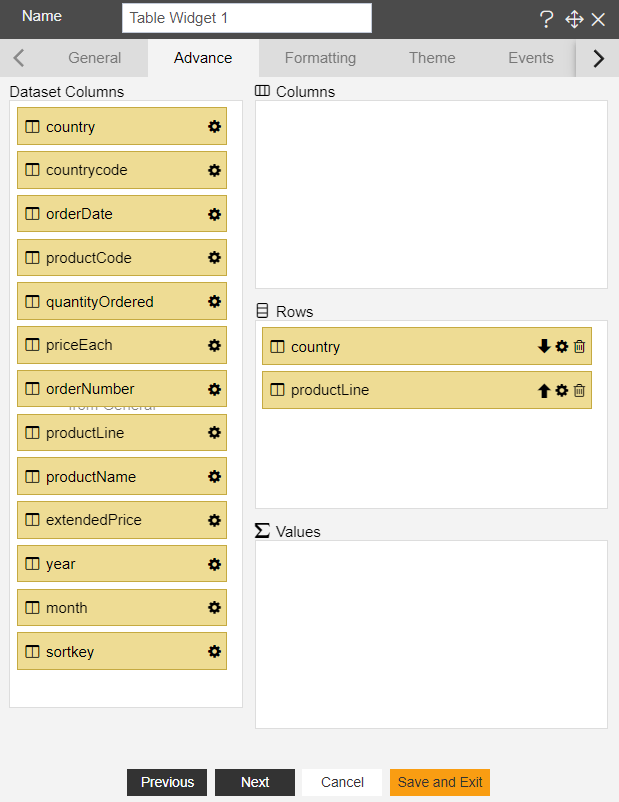
Click on save and exit to save the changes.
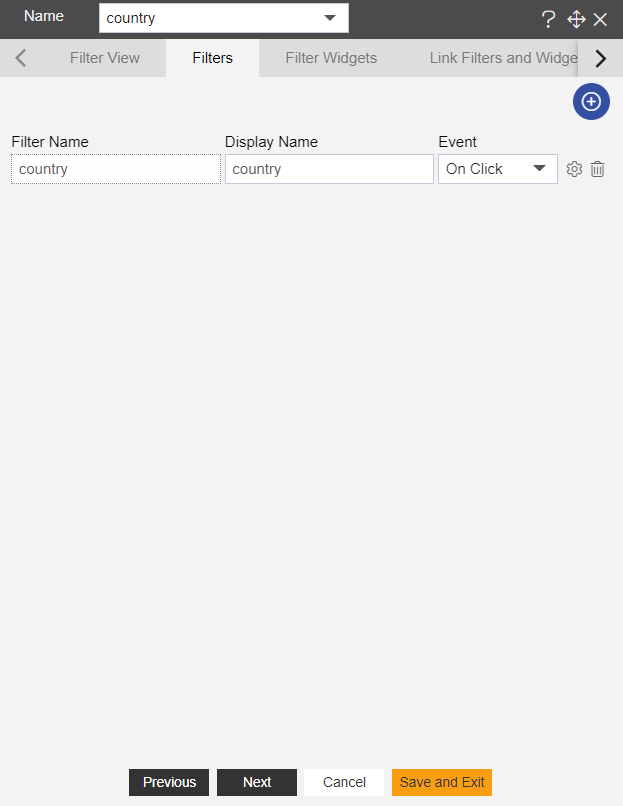
Create a filter and give named country as shown in figure below:
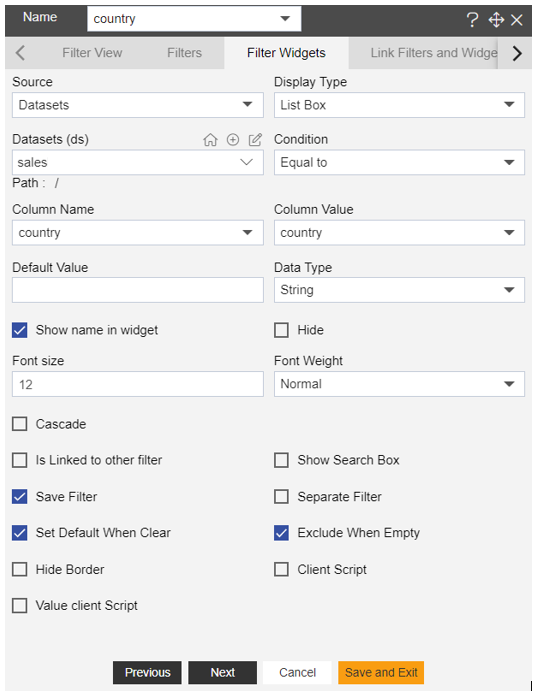
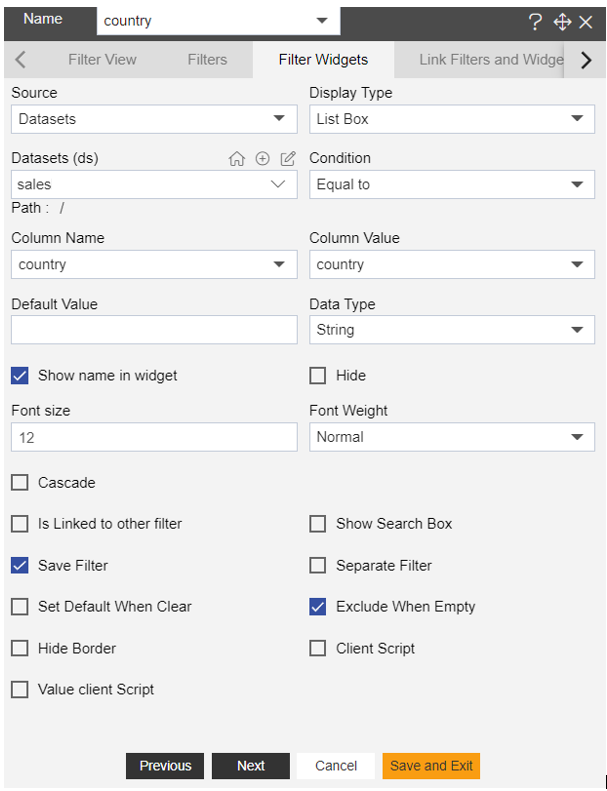
- Click on setting icon of the filter and fill the details in filter Widget:
- Source: Dataset
- Dataset: Sales.Ds
- Column Name: country
- Fill above details, As shown in figure below:
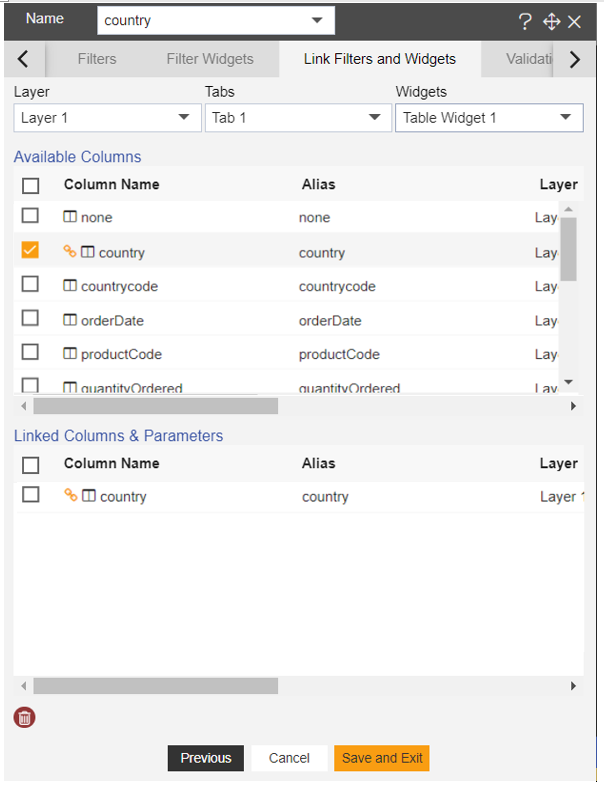
- Click on Link Filter and Widgets Option and enter the details as below:
- Layer: Layer1
- Tabs: Tab 1
- Widget: Table Widget 1
- Fill above details, As shown in figure below:
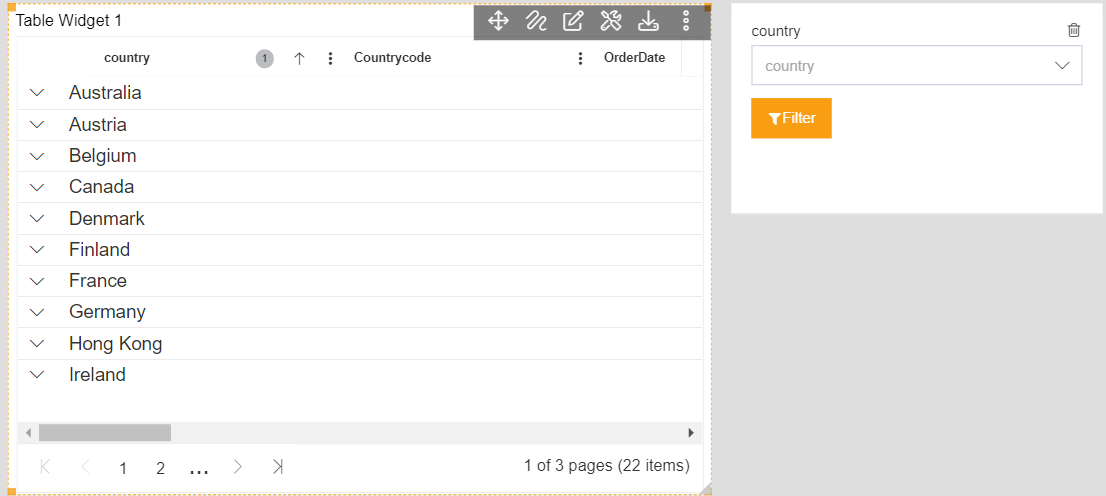
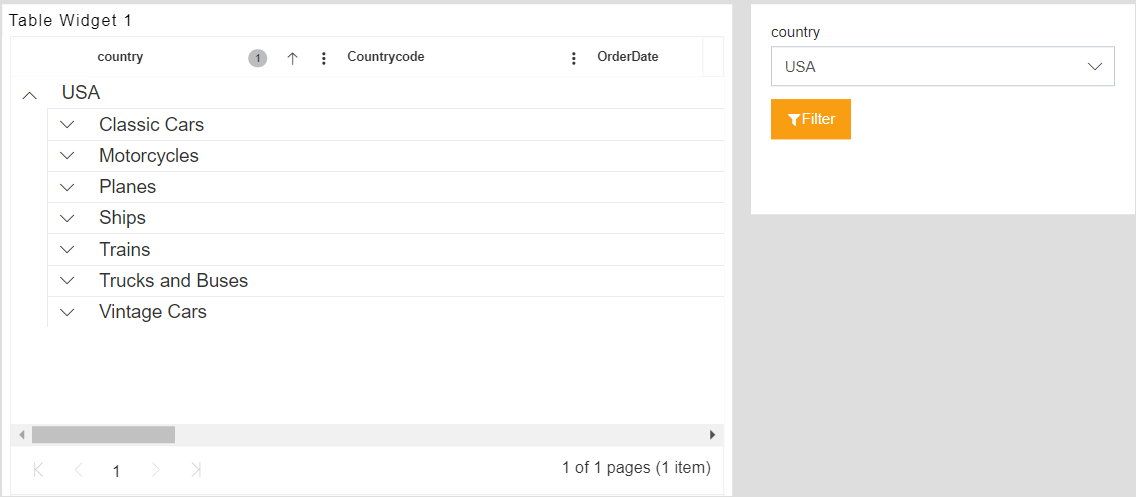
Click on Filter view property and click on + icon of the country.
Click on Save and Exit.
Fill above widgets, as shown in figure below:
Create a New Dashboard and give name Detailed of the dashboard.
The Edit menu box appears as you click on Pie chart. And a widget gets added in content place automatically in dashboard.
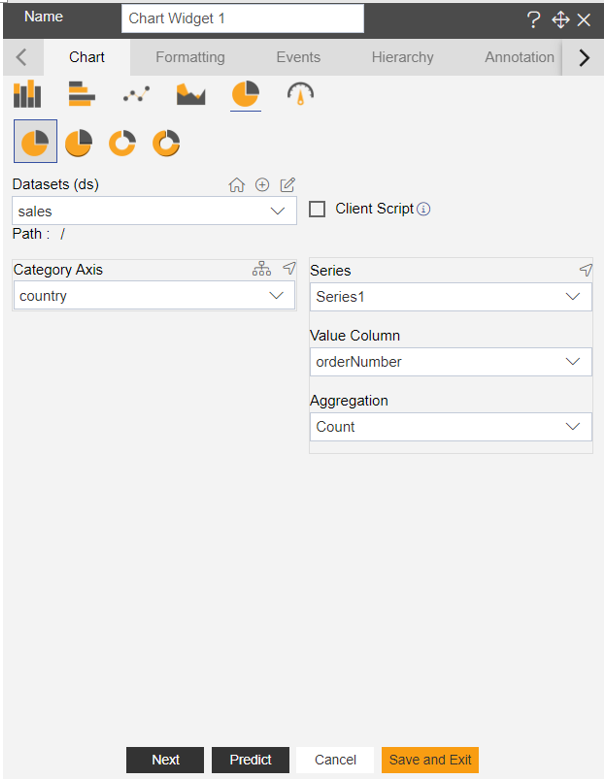
Enter Following details in Chart Property.
Dataset: sales.ds
Category Axis: country
Value Column: Order Number
Aggregation: Sum
Select all the field in Dataset Columns.
Fill above details as shown in figure below:
Click on Preview and Save and Exit.
Add one table widget in the Detail dashboard.
The Edit menu box appears as you click on Table Widget icon. And a widget gets added in content place automatically in dashboard.
Enter Following details in General Property.
- Dataset: sales.ds
- Select all the field in Dataset Columns.
- Fill above details as shown in figure below:
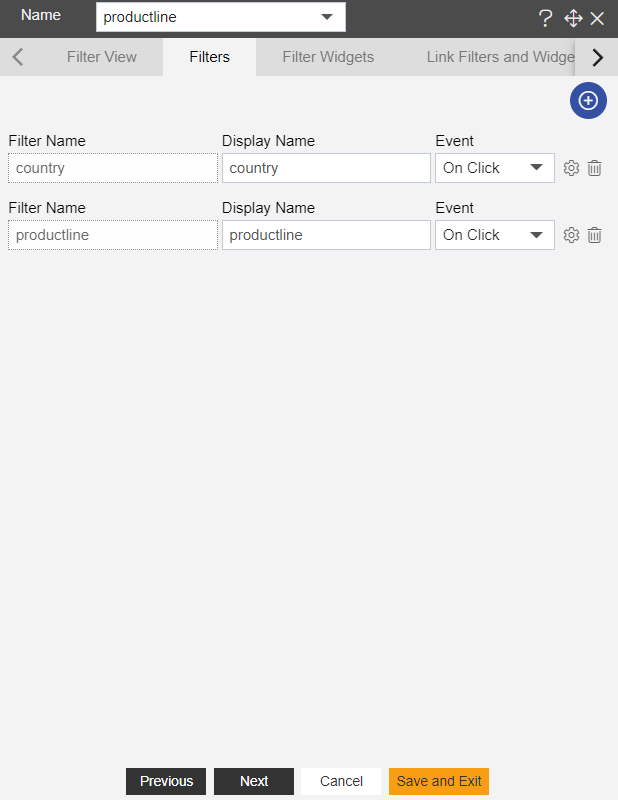
- Add two filter country and productline in the dashboard, As shown in figure below:
Click on setting icon of the country filter.
Enter the following details in Filter widget.
- Source: Dataset
- Dataset: sales
- Column Name: country
- Fill above details, As shown in figure below:
Click on Link filter and widget option.
Enter the following details in Filter widget.
- Layer: Layer1
- Tab: Tab1
- Widget: Chart Widget, Table widget
- Both widget link with country column.
Click on setting icon of the productline filter.
Enter the following details in Filter widget.
- Source: Dataset
- Dataset: sales
- Column Name: productline
Click on Link filter and widget option.
Enter the following details in Filter widget.
- Layer: Layer1
- Tab: Tab1
- Widget: Chart Widget, Table widget
- Both widget link with productline column.
Click on Filter view property and click on + icon of the country & productline.
Click on Save and Exit.
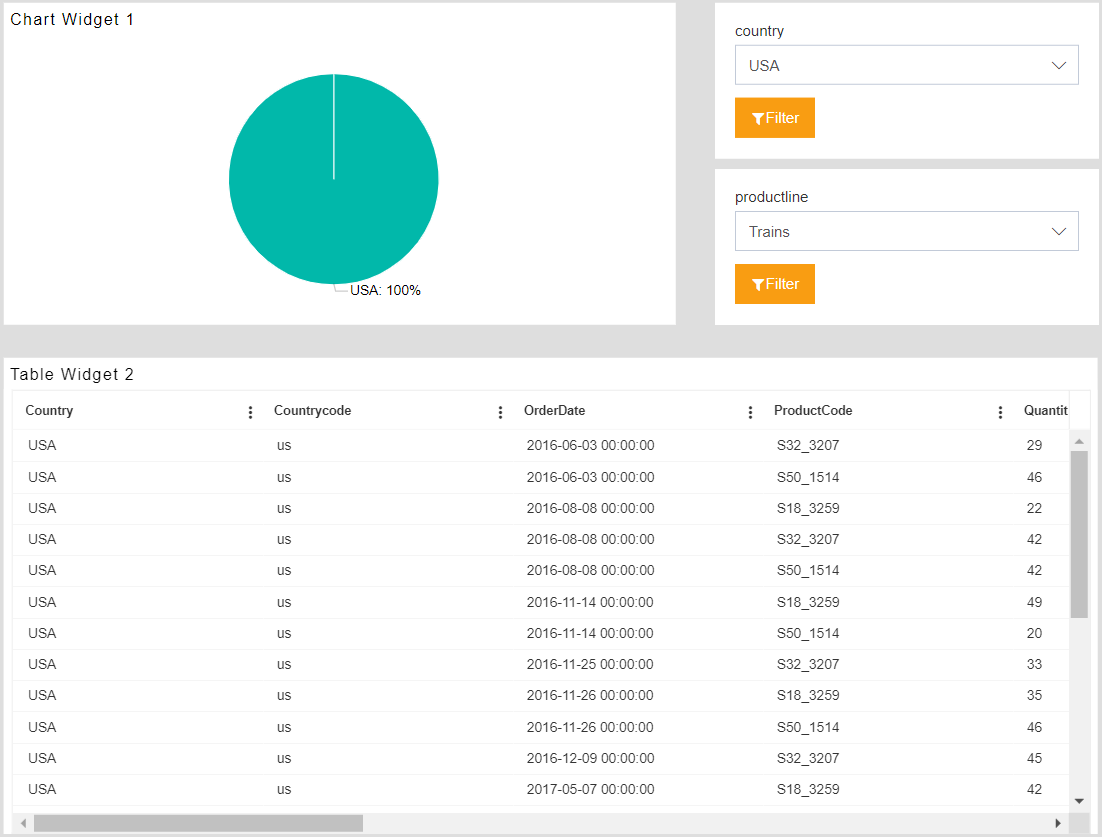
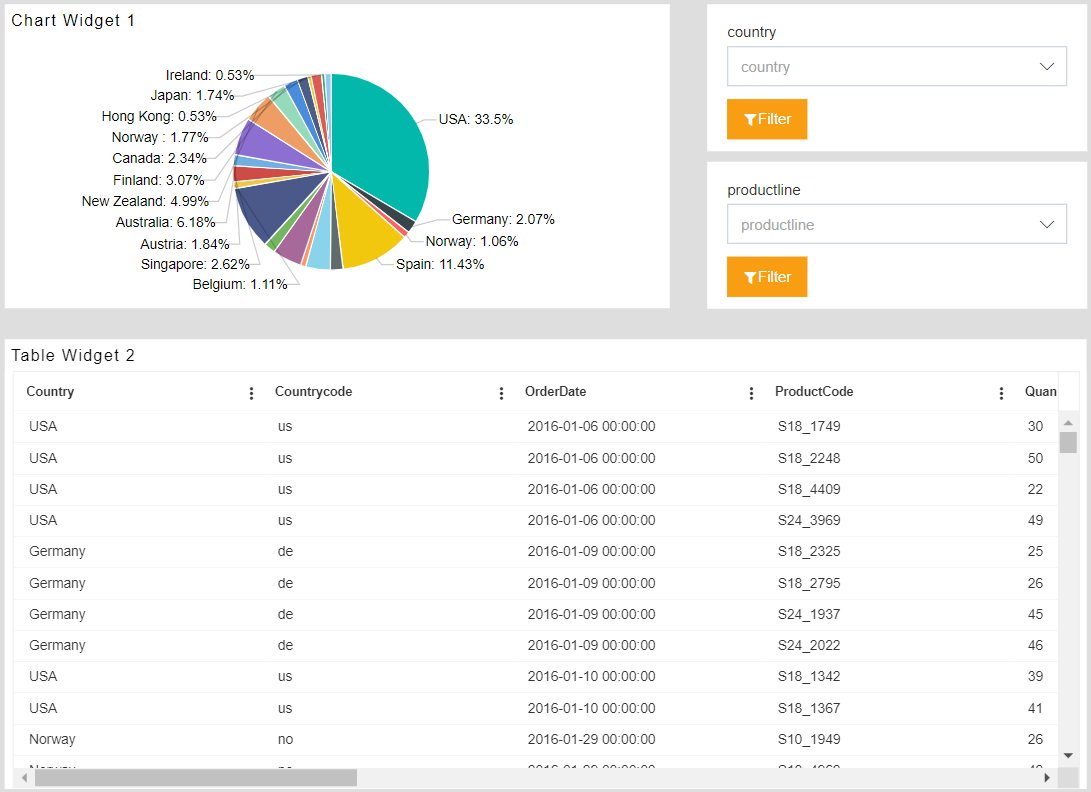
Fill above widgets, As shown in figure below:
Click on embed icon of the detailed dashboard and copy the external embed link.
Now, go to the summary Dashboard.
Edit Table widget and go to event section and write below script:
:::tip

**var tab = new CustomEvent("OPNBI-get-Filter",{ "detail": ""});

window.parent.dispatchEvent(tab);

setTimeout(function(){

console.log(event);

var filters =JSON.parse(sessionStorage.getItem('OPNBIFilters'));

console.log(filters[0].modelName);

var country=filters[0].modelName;

var productline=event.event.key;**

:::
Click on save and exit button to save changes.
Go to preview and apply country filter on table.
- Click on any product line. Let's say click on Trains. As soon as you click on Trains, it will open detail dashboard in new tab and data of detail tab is filtered by product line clicked and filter value.